When was the last time you checked your profit and loss statement?
Yes, you’re a small business owner with a million things to do, but you should learn how to create this simple financial report. It will help your business. I’m going to show you how.
A profit and loss statement (P&L) can help you measure your business growth, spot upward or downward trends, and head off trouble. I check my profit and loss statement and other financial reports monthly so that I can make business decisions based on real data, not just hunches (although those are important too.)
What is a profit and loss statement, and why is it important?
This financial report shows your total revenues for a stated period of time, compared to your total expenses in all areas. When you subtract your expenses, you’ll know your company’s net earnings, or its profit or loss. You can also figure your gross profit margin using the profit and loss statement, but more about that later.
Here’s how to calculate your profit or loss:
Revenue minus Cost of Goods Sold (COGS)
minus Operating Expenses (OPEX) minus Taxes = Profit or Loss
Stay with me -- I'll define each of the parts.
Revenue is everything you have sold during a given period of time. If you sell multiple products or services, you can include each one as its own line item, and then find your total revenue.
Cost of Goods Sold (COGS) is what you spend to make or purchase the items or services that you sell, including your labor costs to produce the product or service. Again, you can include the cost of each product on its own line.
Operating Expenses (OPEX) are the costs of running your business, including utilities, rent, insurance, supplies, travel costs, licenses, etc. Operating expenses also include the salaries and wages that you didn’t include in the COGS figure, as well as payroll taxes and sales taxes.
Taxes include any federal, state, or local income taxes you paid on the taxable income for your business during the given period. It’s best to list each tax you paid on its own separate line.
Now let’s look at an example.
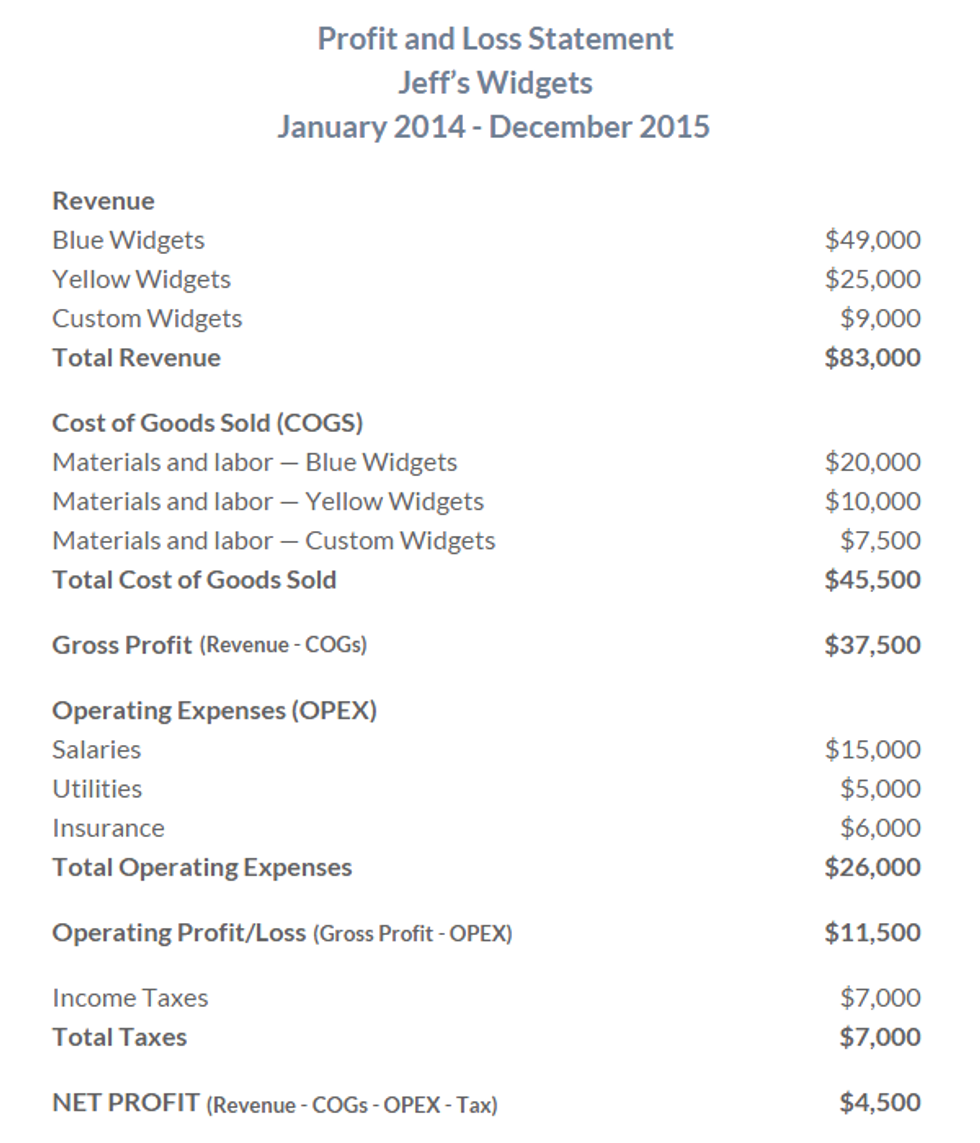
The best-selling product at Jeff’s Widgets has always been blue widgets, followed by yellow widgets. However, Jeff has a hunch that the custom widget business is really going to take off. He has applied for a bank loan to buy new machinery, and the bank is asking to see a P&L as well as other information.
If Jeff were using an accounting software program, he could easily generate a profit and loss statement. However, Jeff still uses an handwritten ledger for his business bookkeeping, so here’s what he has to do.
First, he will add up his sales revenue for the selected time period, and then subtract the cost of goods sold, his operating expenses, and taxes to arrive at his profit or loss.
Obviously, most profit and loss statements will be more complicated, depending on the nature of the business. You may need to account for depreciation (aging) of equipment, or unusual one-time expenses or gains, such as legal expenses or an unexpected windfall.
Based on these numbers, though, it looks like Jeff’s foray into custom widgets may not be a profitable move yet! Jeff’s operating costs seem to be high, so he may need to find a new insurance broker and forgo his salary until business improves.
How else can Jeff use this info?
- He can compare P&Ls for two separate years, and analyze the variance between figures. For example, why did sales increase by $16,000 or 20%? Why have office supplies decreased $450 or 13%?
- He can compare monthly P&Ls to highlight positive and negative trends. Perhaps sales increased each month in the last quarter, or postage costs doubled in May compared to other months - why? He can also be on the lookout for seasonal trends, like the fact that blue widget sales drop off every summer.
- He can discover unusual costs by expressing each line item on the P&L as a percentage of sales. If his Professional Fees expense equals 23% of the sales, his attorney may be a bit too pricey!
- He can divide his sales by the number of employees to find his average sales per employee, and then compare to other periods to see if efficiency is improving or declining.
- He can track sales or net profits against other nonfinancial statistics. For example, he might track his website visits to predict how the business will fare going forward.
Figuring the Gross Profit Margin
Another measure is the gross profit margin, which is the ratio of gross profit to total revenue, expressed as a percentage.
Gross Profit divided by Revenue = Gross Profit Margin (x 100)
Jeff will divide his gross profit of $37,500 by his revenue of $83,000 = 0.45, then multiply by 100 = 45%. For each product Jeff sells, he makes 45% of the sales price as profit. That seems pretty good, but how does he know for sure? Jeff can research industry benchmarks to see how he measures up to the competition. He can join a trade association, such as the National Association of Manufacturers, to find helpful financial data, and find other helpful data as Bizstats, Census.gov, or the IRS.
Once he has some real data to work with, he can improve his processes, look for ways to save on materials without sacrificing quality, or pare down overhead costs to become more profitable. If he cannot cut costs any more, he might have to spend money to make money -- increasing his advertising or optimizing his website so potential customers can find him. Then, as he tweaks his business, he can compare his gross margin over different points in time and watch for improvements. Obviously, the higher the percentage, the better for business!
Once you get used to analyzing your profit and loss statement, you will have a better read on your business. It’s actually kind of cool to watch your numbers improve -- really!