branch of Cost-Volume-Profit (CVP) Analysisthat determines the break-even point, which is the level of sales where total costs equal total revenue. Thus, zero profit results. Breakeven sales is computed as follows:
Break-even sales in units= Fixed costs/Unit contribution margin.
Break-even sales in dollars= Fixed costs/Contribution margin ratio.
For example, assume:
Fixed costs = $15,000.
Unit contribution margin (selling price - unit variable cost) = $15, and Contribution margin ratio (unit CM/selling price) = .6
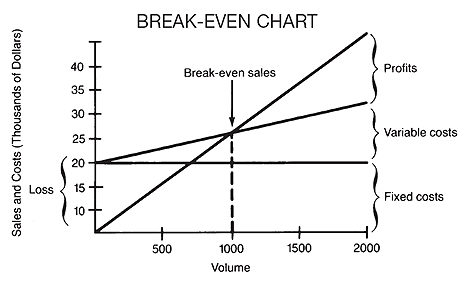
Then, break-even sales in units= $15,000/$15 = 1000 units andbreakeven sales in dollars= $15,000/.6 = $25,000.
A break-even chart is one in which sales revenue, variable costs, and fixed costs are plotted on the vertical axis while volume is plotted on the horizontal axis. The break-even pointis the point at which the total sales revenue line intersects the total cost line. See the sample chart below.
financial analysis that identifies the point at which expenses equal gross revenue for a zero net difference. For example, if a mailing costs $100 and each item generates $5 in revenue, the break-even point is at 20 items sold. A profit will be made on items sold in excess of 20. A loss will result on sales under 20. The breakeven point may be analyzed in terms of units, as above, or dollars.
financial analysis that identifies the point at which expenses equal gross revenue for a zero net difference. For example, if a mailing costs $100 and each item generates $5 in revenue, the breakeven point is at 20 items sold. A profit will be made on items sold in excess of 20. A loss will result on sales under 20. The break-even point may be analyzed in terms of units, as above, or dollars.
